The significance of Yield on Cost (YOC) in real estate investments cannot be overstated, as it stands as one of the most critical metrics in evaluating long-term investment performance. By providing a comprehensive view of the return on the original investment, YOC offers valuable insights into the profitability and sustainability of real estate ventures over time. Understanding and effectively utilizing YOC empowers investors to make informed decisions that align with their financial objectives and strategic goals in the real estate market. Let me ask you something: Are you still using cap rates to evaluate your multifamily deals? If so, you’re probably leaving money on the table—and I’m about to show you exactly why.
After analyzing hundreds of value-add multifamily investments over the past decade, I’ve watched many sharp investors get burned by the same mistake. They chase “attractive” cap rates only to discover their actual returns tell a completely different story.
There’s a better way, and the smartest operators in our space have already made the switch.
The $2 Million Wake-Up Call
Picture this: You buy a 75-unit property at what looks like a solid 6% cap rate. You pump $2 million into renovations—new kitchens, updated amenities, the works. Eighteen months later, comparable sales suggest the market cap rates have expanded to 6.5%.
Your spreadsheet shows you’re “underperforming.” Your investors are asking questions. But here’s the kicker—your property is actually generating exactly the returns you projected. The market moved, not your investment performance.
And this is the disconnect I often see.
The cap rate tells you where similar properties on the market are trading.
Yield on Cost tells you how well you’re executing.
Meet Your New Best Friend: Yield on Cost
Forget everything you think you know about measuring multifamily returns. Yield on Cost is the metric that separates the pros from the pretenders, and here’s why it’s revolutionary:
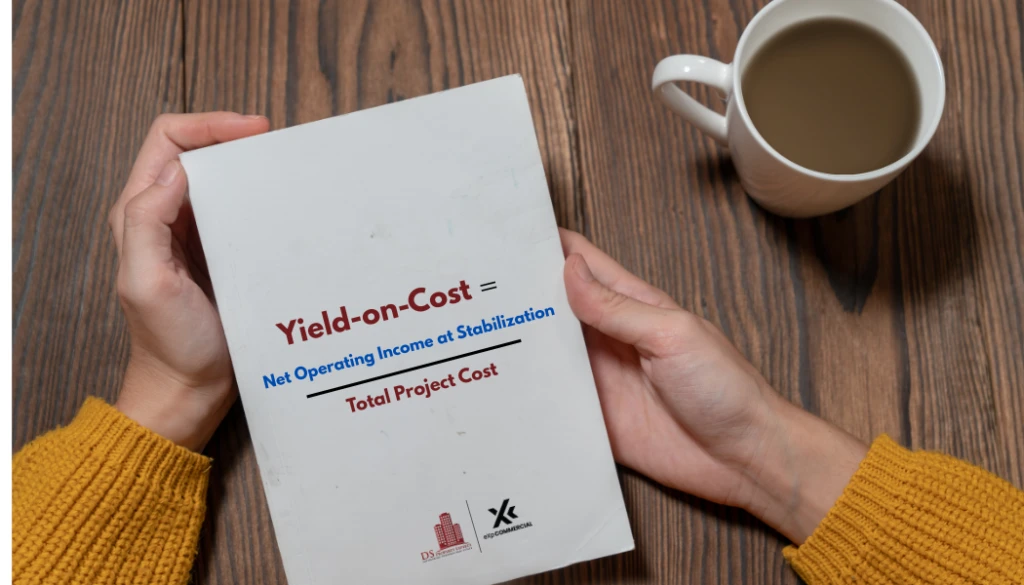
The Formula That Changes Everything:
Yield on Cost = (Net Operating Income (stabilized) ÷ Total Investment Cost) × 100
Sounds simple, right? That’s the beauty of it. But the power lies in what “total investment cost” actually includes:
- Your acquisition costs (purchase price, closing, due diligence)
- Every dollar of improvements (in the example above, that’s $27k per unit renovation)
- All those carrying costs that tend to be overlooked (debt service during construction, vacancy losses)
Why This Beats Cap Rates Every Single Time
Here’s what cap rates won’t tell you: When you buy that $7.5 million property and spend another $2 million making it shine, your real investment isn’t $7.5 million—it’s $9.5 million. Cap rates ignore this reality. Yield on cost embraces it.
Let’s say your stabilized NOI hits $665,000. Your yield on cost? A solid 7%. And here’s the beautiful part—this number doesn’t care about market sentiment, interest rate swings, or whether your neighbor sold at a crazy multiple.
The Value-Add Advantage
I’ve seen investors celebrate “beating” their projected cap rates while quietly missing operational targets—and others panic over market shifts, even when they’re hitting every performance milestone.
Here’s how it happens:
You acquired the property for $7.5 million and invest another $2 million making it shine—new systems, upgrades, repositioning the tenant base. Your real investment isn’t $7.5 million—it’s $9.5 million.
Cap rates ignore that.
Yield on Cost embraces it.
Let’s say your stabilized NOI is $665,000.
That’s a 7% Yield on Cost—a solid return on your all-in basis.
Now imagine cap rates expand to 7.5%.
Traditional models scream “failure.”
Valuation dips. Spreadsheets flash red.
But your Yield on Cost didn’t flinch.
It tells you one thing:
You executed the business plan exactly as intended.
The market moved.
You didn’t underperform—your metric just wasn’t cap rate.
Cap rates are useful, but they don’t tell the whole story.
Real Talk: Implementation That Actually Works
Listen, I’ve seen too many investors get excited about yield on cost and then botch the execution.
Here’s how to do it right:

Track Every Penny (Seriously)
Your biggest enemy isn’t market volatility—it’s cost creep. That “simple” $15k per unit renovation becomes $22k when you factor in:
- Permit delays that extend carrying costs
- Material price increases mid-project
- Those “while we’re at it” upgrades that seem smart in the moment
Use digital tracking systems. Spreadsheets lie, especially when you’re managing multiple projects.
Conservative NOI is King
I see investors inflate their yield calculations with fantasy NOI projections. Don’t be that person. Stress test, by using 90-95% of comparable market rents, assume a realistic vacancy, rent growth rate, and pad your expense ratios.
Better to under-promise and over-deliver than chase phantom yields.
The Portfolio Power Play
Here’s where yield on cost becomes your secret weapon: cross-market comparisons that actually make sense.
That Class B property you bought in 2021 during the peak might show a 9% yield on cost, while your “steal of a deal” from 2023 only hits 6%. Guess which one’s actually performing better?
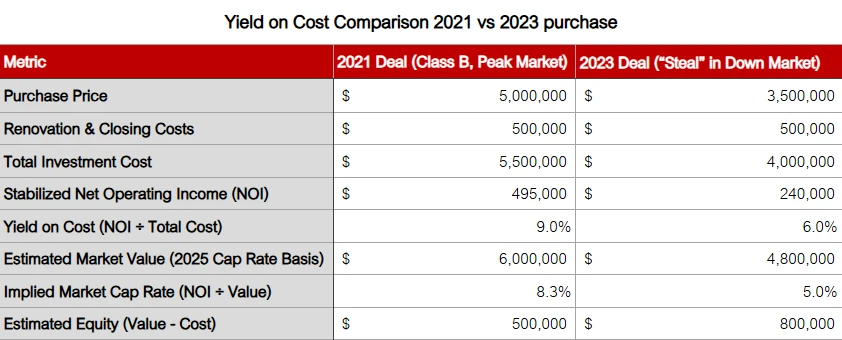
Why a Higher Yield-on-Cost
At first glance, a 9% yield-on-cost (YOC) looks better than 6%. But as the comparison table above shows, that’s not always the case.
Take the 2021 Class B property. It was purchased at the market peak, likely at an inflated price. While the YOC today is 9%, it reflects a high cost basis—not necessarily strong performance.
Now look at the 2023 deal. Bought at a discount in a softer market, its current YOC is 6%, but the equity growth and upside potential are stronger. Despite the lower yield, it’s arguably the better long-term investment.
The Key Issue with YOC Alone
YOC tells you your return based on cost—but it doesn’t reflect:
- Today’s market value
- Risk and location dynamics
- Value-add upside
Beyond the Basics: Your Complete Toolkit
Yield on cost doesn’t work alone. Smart investors layer it with:
- Cash-on-Cash Return: Shows how leverage amplifies your equity returns
- IRR Projections: Uses yield on cost as the operational foundation for exit modeling
- Market Cap Rate — Is your YOC above it?
- Equity Growth — Has your value outpaced cost?
Think of yield on cost as your North Star—it keeps you pointed toward true operational performance while other metrics handle the details.
The Reality Check: Common Pitfalls
I’ll be straight with you—implementing yield on cost isn’t always smooth sailing:
Carrying costs will surprise you. That $5 million acquisition with $2 million planned improvements? Expect another $500k-$750k in carrying costs you didn’t budget for. I’ve seen investors’ yields drop a full percentage point because they forgot about debt service during the renovation period.
Timing matters desperately. Don’t calculate your final yield until you hit 90% occupancy for at least three months. Premature celebrations lead to disappointing returns.
Your Competitive Edge Starts Now
Here’s what the top 10% of multifamily investors understand: Markets cycle, cap rates fluctuate, but operational performance endures. While your competitors chase yield on cost metrics that change with the wind, you’ll be building wealth based on fundamental business performance.
The 2022-2024 interest rate chaos proved this perfectly. Properties with strong yield fundamentals (7%+) sailed through 200 basis point cap rate swings while weaker deals got crushed by market sentiment.
The Bottom Line
Don’t let market emotions drive your investment decisions. Cap rates tell you what happened yesterday. Yield on cost tells you what’s happening to your money right now, today, in the real world where your returns matter.
The multifamily game is evolving toward longer holds and deeper value-add strategies. The investors who master yield on cost analysis will separate themselves from the pack—in deal sourcing, risk management, and long-term wealth creation.
Your move: Pull up your last three deals and run the yield on cost numbers. I guarantee you’ll see your portfolio performance in a completely new light. And once you do, you’ll never go back to cap rate tunnel vision again.
The question isn’t whether you can afford to adopt yield on cost analysis. The question is whether you can afford not to.